 地址:辽宁省大连市中山区丹东街55号302室
 电话:0411-82708388
 邮箱:
邮箱: 网址:
网址:


服务热线
0411-82708388
 咨询热线
咨询热线1. A review on the export and import
1.1 2012 exports
China produced about 2million tonnes talc and chlorite in 2012.Of that, 519kt ground talc, 233kt crude and 310kt chlorite were exported amounting to USD216million. Figure 1 shows rank of the top 8 importers and their quantities . Japan was the largest importer followed by South Korea, Thailand, USA, Indonesia, Malaysia, Taiwan, and Philippine. Exporting market shares of the three Chinese export areas are shown in figure 2. Liaoning accounted for 66% ranking first, Guangxi for 20% and Shandong for 14% respectively. In details, Liaoning exported 399.3kt ground talc, 94.59kt crude talc and 68.7kt chlorite; Guangxi 97.2kt ground talc and 114.8kt crude talc; Shandong 22kt ground talc, 19.9kt crude talc and 46.2kt chlorite respectively. While Guangxi shares advantages in crude talc, Liaoning has advantages in ground talc and chlorite.
.jpg)
Figure 3 shows that Chinese export experienced a downward trend during the past 5 years from 2008 to 2012. The total quantity decreased significantly to 1.06 million tons with a 9.2% decrease rate annually. Apparent talc exports have been increased since 0 50 100 150 200 250 300 350 Philippine Taiwan Malaysia Indonesia USA Thailand S.Korea Japan Ground Talc Crude Talc Chlorite Quantity, kt liaoning 66% Shandong 14% Guangxi 20% 3 / 16 2009. However, this increase was caused by a revision of the statistics method defining the distinction between talc, talc mixture and chlorite. During the past several years low grade talc was categorized as talc mixture or chlorite. In 2008 Chinese Customs redefined that talc mixture containing over 50% talc by weight should be considered talc. Thus, the export quota has been required. Consequently, this new definition led to a decrease in the quantity of chlorite, and an increase in the talc statistically.
.jpg)
1.2 2012 and 1st half 2013 imports
In contrast to export, the import volume has increased significantly in recent years. Figure 4 shows imports from 2008 to 2013(Jun). The volume was as high as 40.22kt in 2012 , of which 0 300 600 900 1200 1500 1800 2008 2009 2010 2011 2012 Chlorite Talc Qty, kt Year 4 / 16 18.6kt was ground talc and 21.58kt was crude talc. The ground talc was imported mainly from USA, Korea and Italy. The crude talc was imported from Pakistan, North Korea, and Egypt. In 1st half 2013, 8.5kt ground talc and 10.6kt crude talc were imported.
.jpg)
1.3 The 1st half 2013 export
Chinese talc is facing the biggest drop and the most difficult time in 2013 which are even worse than those in 2009 when the worldwide financial crisis occurred. Although Chinese export reduced in 2009, high demand from domestic market offset the decrease in export. In 2013 both the domestic and export market are shrinking. China only exported 223kt ground talc, 84kt crude talc and 115kt chlorite totaling 422kt in the 1st half year of 2013,. As shown in Table 1, the export of crude talc, ground talc and chlorite 0 10 20 30 40 50 60 2008 2009 2010 2011 2012 2013(Jun) Ground Talc Crude Talc Year Qty,kt 5 / 16 reduced by 27.79%, 4.94% and 26.19% respectively on year-on-year basis.
The Chinese talc price has been rising since 2000 as shown in figure 5. In the last 5 years, the increase rate was around 5-10% per year . As a result, The price of crude talc is higher than that of other Asian producers. The prices of some ground talc are even higher than international average one. The middle to low grade is no longer competitive. By 2012, Chinese talc price had been beyond what the market can bear, which indicated there is no margin left for further increase. The increasing price during the past decade has greatly stimulated the productions in other countries. Many foreign importers have tried to find alternatives outside China. The demand for Chinese talc was suppressed leading to oversupply. As a result the export reduced, especially the middle to low grades (see figure 6). In 2013 the price of some grades in CNY are soft. But even through the cost in CNY has weakened variations in USD and other currencies have still resulted in net increase in export costs. The CNY has been appreciated by 34% against US dollar in the past 8 years. This is one of the major reasons that Chinese talc has been more and more expensive.
Talcs from Afghanistan , Pakistan as well as India are more and 6 / 16 more competitive. The advantage of Chinese talc is being challenged tremendously. As the price increases, Chinese international market share is shrinking. The world market has relied on Chinese white talc extensively for more than 20 years but now it is changing year after year. If Chinese talc price increases further, its exports will shrink quickly in the next few years. The domestic market started to go down in 2013 for the first time in 12 years. China consumes 50% of its own talc. The major applications are paper making, polymer, paint & coating and ceramics. The volume increase in polymer has been as high as 5%- 10%. But all industries above have been in recession at the beginning of 2013. The Chinese talc industry needs exports for survival. Chinese talc producers should not only offer a more competitive price but also commit to a stable supply in long term.
.jpg)
.jpg)
2. An Outlook for Chinese Talc
There is no doubt that Chinese talc industry will develop but the growth rate will slow down. The aims and objectives will be 50 100 150 200 250 300 2000 2002 2004 2006 2008 2010 2012 Crude Talc Ground Talc Price, USD/mt Year 100 140 180 220 260 300 600 800 1000 1200 1400 1600 1800 2008 2009 2010 2011 2012 Qty(Talc+Chlorite) Crude Talc Ground Talc Qty,kt Price, USD/mt Year 8 / 16 adjusted. Producers will no longer be interested in just increasing output but will give more attention to sustainable development, comprehensive utilization of resources, energy saving and efficiency improvement. Therefore, the following trends will occur in Chinese talc industry:
2.1 The reduction of crude talc export
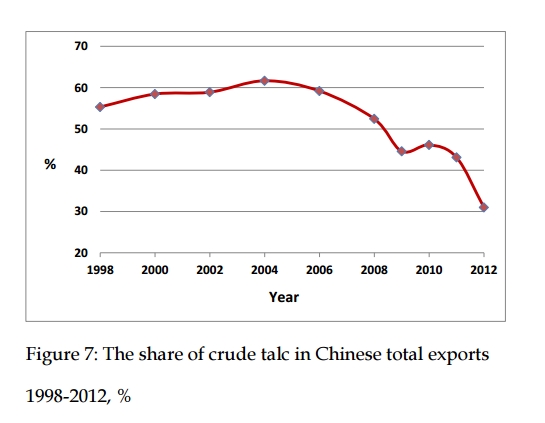
The annual output of Chinese talc and chlorite could reduce to 1.8-1.9 million tonnes in 3 to 5 years comparing to current 2million tonnes. Although the export quantity could be kept at about 1million tonnes annually, the share of crude talc will continue to reduce as shown in Figure 7. Both the domestic and export markets require more Chinese ground talc, which is the trend preferred by Chinese producers. The availability of Chinese crude talc, especially high quality one, is reducing while more crude talcs are available from other countries and compete with Chinese products. For example, there are incredible growths of Afghanistan and Pakistan talc exports showing in figure 8. Its annual growth rate was as high as 613% during the past two years. The price of crude talcs from Afghanistan and Pakistan are well below Chinese price. They are partially replacing Chinese talc in USA, Europe as well as Asian market.
.jpg)
2.2 The importance of the domestic market
In the past 30 years, the export was the major motivation for the development of the Chinese talc industry. However In the future, domestic market demand shall exceed export demand and become the main driving force for further growth. In 2009, Chinese outputs of papermaking, coating, automobiles, and ceramics were listed as the world’s largest. All of the above markets appeal with great potential as main application fields for talc. Yangtze River Delta and Pearl River Delta are the leading consumption areas. The fastest growth section shall be in plastics, especially PP for automobile industry, household appliances and packaging products. Its annual growth rate shall revert to 5%-10%.
2.3 The importance of the Asian market
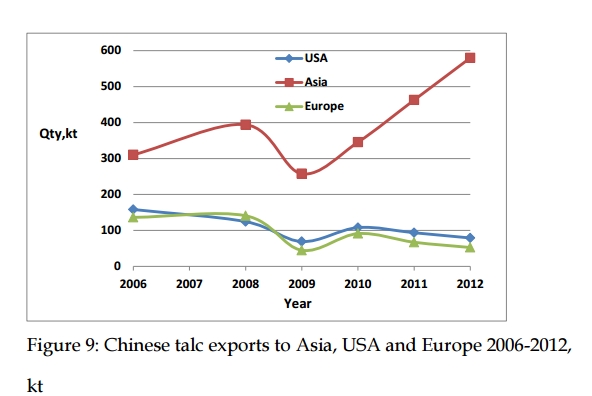
Figure 9 shows that Chinese exports to Asia were increasing while to USA and Europe were reducing between 2006 and 2012. Such trend should continue. There is no doubt China would still be the largest producer, consumer, and exporter in the world. However, its major market would return to Asia like 20 years ago. USA and Europe mainly need high quality Chinese crude talc. But the output and availability are reducing and the price is increasing. China would no longer export as large a quantity as the past to USA and Europe. On the other hand, the Asian market not only 11 / 16 needs high quality crude talc but also high quality ground talc as well as middle to low quality ones. The Asian consumption pattern contributes to the healthy development of Chinese talc industry, and comprehensive utilization of the resources. The biggest market for Chinese talc will be in its domestic market, followed by Asian nations. 85% of Chinese talc will be consumed in Asia in the future.
2.4 Price Trend
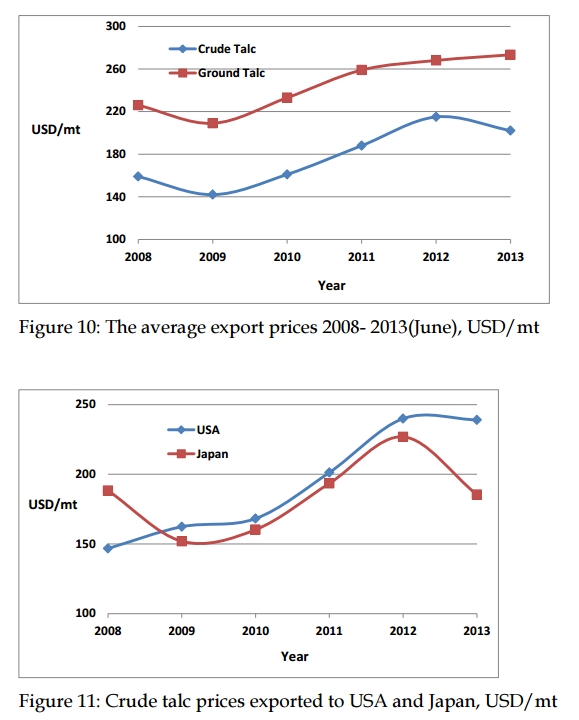
Figure 10 shows the crude talc and ground talc prices from 2008 to 2013( June). Before 2012, both the ground talc and crude talc prices were increasing simultaneously. The crude talc price started to fall 0 100 200 300 400 500 600 2006 2007 2008 2009 2010 2011 2012 USA Asia Europe Qty,kt Year 12 / 16 in 2013 while the ground talc price still kept increasing slightly. Figure 11 shows the prices of crude talc exported to USA and Japan. USA mainly needs high quality crude talc while Japan requires all grades from high to low. Thus USA market represents high quality requirement while Japanese market represents average one. It is interesting to note during the two recession periods of 2008 to 2009, and 2012 to 2013, the above two market prices showed the same trend: the Japanese price decreased while surprisingly the US price still increased. It indicates high quality crude talc has been in shortage and its price has increased even in the recessions. But the pieces of middle to low grade have dropped due to oversupply during the recession. The trend above will continue: the prices of high quality Chinese talc lumps and their powders will still be strong while the prices of middle to low grades will be soft.
2.5 Development following Market Rules
There are six non-metallic minerals required export quotas since 1995. A change appeared in 2013. All the quotas were waived except for talc and magnesium. No one knows the reason talc and 100 140 180 220 260 300 2008 2009 2010 2011 2012 2013 Crude Talc Ground Talc Year USD/mt 100 150 200 250 2008 2009 2010 2011 2012 2013 USA Japan Year USD/mt 14 / 16 chlorite are regarded as resources at strategic positions in China. In 2013, the volume of talc export quota is 720kt. Although the quota is distributed to 42 companies, the top ten get 68.5% of the volume. In 2009 China started to collect 10% export tax on crude talc, coarse talc, chlorite and 5% on micronized talc to restrict their exports.
The original intention of implementing quota and tax was to reduce the export volume of crude talc, coarse ground talc, and increase that of high value-added micronized talc. But the problem is all of them regardless of quality share the same quota. Although the total export volume is under control, only the export of middle to low grade talc and chlorite are suppressed while the high grade crude talc export is never affected negatively. The reason is the cost of export quota and tax accounts for up to 30% of the export cost for middle to low grades, resulting in prices being so high that they are no longer competitive. On the other hand, the high grade crude talc is in short supply and the price is higher. The quota and export tax account for a small part of their export cost. Thus there is no influence on its export.
China is considering their resource tax reform for non-metallic minerals. The current specific duties may be changed to ad 15 / 16 valorem which will lead to duty increasing by 3-5 times. There are also other invisible charges for talc export. For example, the micronized talc should be pre-inspected as per food additive regulations. Although its background is not known, it has been carried out for more than one and half years. All the inspection costs will be borne by the exporters themselves.
Talc and Chlorite are relatively low value and small scale minerals worldwide. As ordinary fillers, they are used to reduce costs, which share identical application fields with calcium carbonate, kaolin,etc. Talc and chlorite are never rare resources. Chinese talc is competing with other fillers for survival but the high prices are declining their exports and result in replacements by other kind of fillers. As a matter of fact, the export volume in 2012 reduced to 1.05millions tonnes comparing to 1.63million tonnes in 2006.
Chinese government intends to utilize and export more middle to low resources and slow down high quality one’s consumption. Unfortunately according to Chinese talc export figures the opposite appears to be happening: the export of high quality crude talc is as usual but middle to low grade is suppressed. It is imperative to review its current policy and reduce or avoid man-made intervention for talc export . It is fair to provide the same export policy to all the non-metallic white fillers including talc. A healthy growth of Chinese talc industry should rely on market rules to realize its maximum values and optimal utilizations.